Search
Items tagged with: exploitation
I'm fascinated by the concept of measuring attacker-defender advantage in software, devices, and even entire IT environments. What do I mean by "attacker-defender advantage?" Lemme sum up and then share a chart.
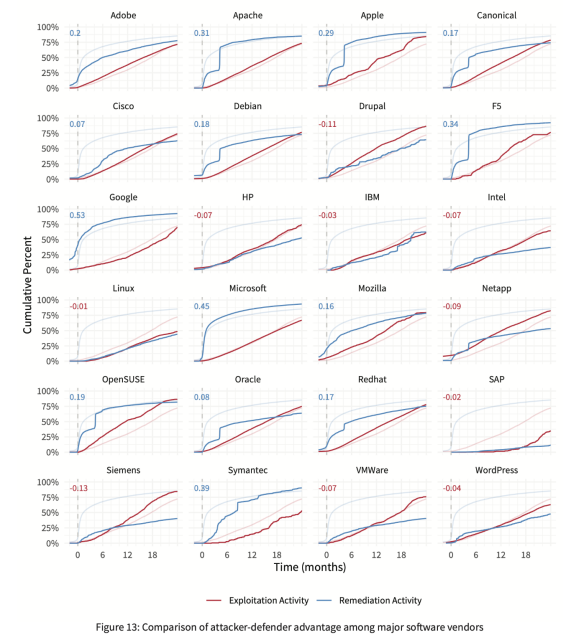
Let's say you could measure the speed at which defenders remediate various types of security vulnerabilities across all relevant assets. Then say you could detect and measure the speed at which attackers find/exploit those vulnerable assets across the target population of organizations using them. Finally, plot those curves (across time and assets) to see the delta between them and derive a measure of relative advantage for attackers and defenders. That relative value is what I mean by attacker-defender advantage.
Since a picture is worth a thousand words, here's a visual example of the concept. The blue line represents defenders, measuring the speed of remediation. Red measures how attacker exploitation activity spreads across the target population. When the blue line is on top, defenders have a relative advantage (remediating faster than attackers are attempting to exploit new targets). When red's on top, the opposite is true. The delta between the lines corresponds to the relative degree of advantage (also expressed by the number in the upper left).
This chart comes from prior Cyentia Institute research in which we were able to combine datasets from two different partners (with their permission). Unfortunately, those datasets/partners are no longer available to further explore this concept - but maybe this post will inspire new partnerships and opportunities!
Any surprises in the attacker-defender advantage results depicted in the chart? Has anyone measured this or something similar?
#cybersecurity #vulnerabilities #cyberattacks #infosec #exploitation

